
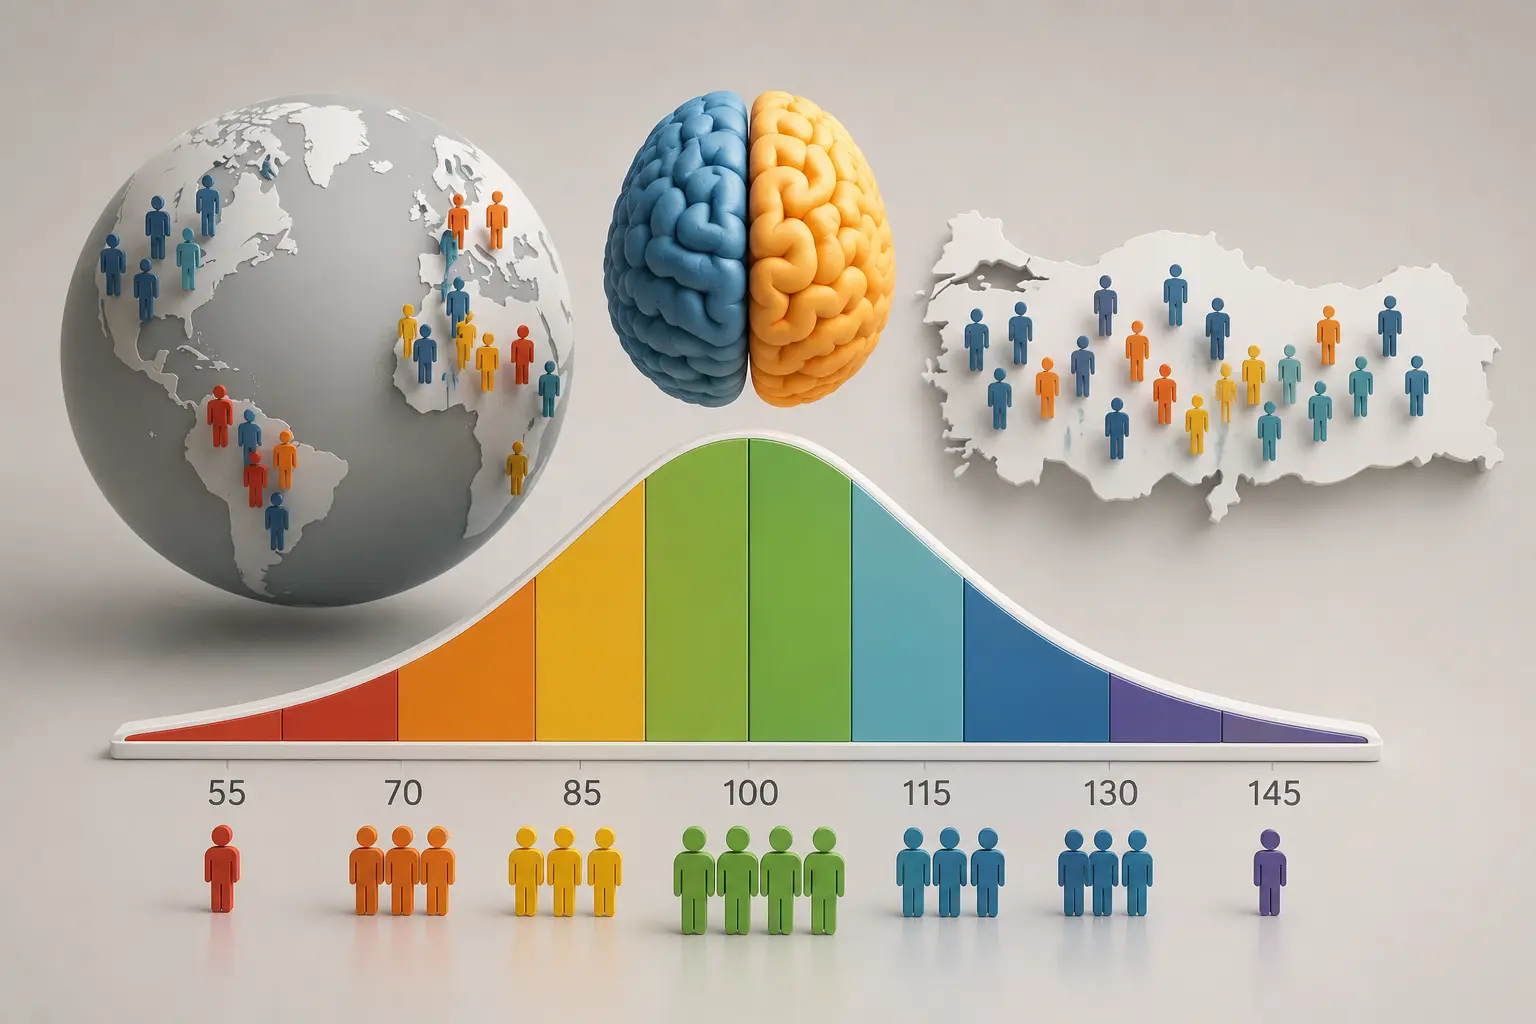
"What is average IQ, and where do I stand?" Maybe you found a chart online called "IQ rankings of countries" and wondered, "What place is Turkey in?" That is completely normal. But behind this simple question is a very interesting fact that is often explained wrong: the short answer is that average IQ is almost always 100 — and not by chance, but by design. Let’s look at what that means and why those country rankings should not be taken seriously.
Why is average IQ always 100?
The secret is in how IQ tests are designed. When a IQ test is developed, it is given to a large sample, and the results are scaled so that the group average comes out to exactly 100. So 100 is not "a law of nature"; it is a reference point. It is like taking sea level as zero and measuring heights from there.
The spread of scores on this scale is also well known: about two-thirds of people (68%) fall between 85 and 115. So what we call "average" is not a narrow point at all; it is a broad, crowded band. 95 is normal, and 105 is normal too. That is why the most honest answer to "What is average IQ?" is boring, but true: 100 by definition.
| Question | Short Answer |
|---|---|
| What is average IQ? | 100 by definition |
| Where is most people’s IQ? | About 68% are between 85-115 |
| Are country IQ rankings reliable? | No, there are serious method issues |
| Does IQ stay fixed over time? | No; it rose across generations (Flynn effect) |
So what are those "country IQ rankings"?
This is the key issue, because this is where most of the misinformation comes from. The "this country’s average IQ is 105, that one’s is 90" tables you see online mostly come from a single source: the "national IQ" datasets compiled over the years by psychologist Richard Lynn and others (for example, the book IQ and the Wealth of Nations).
The problem is that these data have been heavily criticized in the scientific world. The main objections are:
- Non-representative samples: The "average" for an entire country was sometimes based on small samples of a few hundred students or even just one city.
- Guessing from neighbors: For countries with no data, IQ was sometimes made up by taking the "average of neighboring countries." So some numbers are estimates, not measurements.
- Selective data: There are serious criticisms that studies that did not support the result were left out.
- Cultural and education bias: Test performance is strongly affected by familiarity with schooling and test culture, which makes comparisons across societies unfair.
These criticisms are so strong that in 2020 the European Society for Human Behaviour and Evolution issued an official statement against these datasets, saying they were "far below the standard of scientific rigor" and that the results based on them were "not robust." In 2024, a group of scientists called for these studies to be withdrawn, pointing to their methodological flaws and the ideological (racist) purpose behind them. One critic described these tables as "more of a social campaign than science."
In short: when you see IQ tables saying "this country is in this place," be cautious. These numbers are not a reliable measurement.
And the cause-and-effect may be reversed
These tables usually tell a story like "higher IQ → richer country." But critics say the opposite: a society’s average test score mostly reflects that society’s education level, prosperity, and middle class. In other words, better schools, nutrition, and health conditions push test scores up — they are not the cause, but the result. The best proof of this is our next topic.
Flynn effect: the average is not fixed, it is rising
One of the most surprising findings of the 20th century is this: IQ test scores kept rising across generations. Named after researcher James Flynn, this pattern shows that scores increased by a few points on average every decade — about 30 points in total over a century. That is such a large shift that today’s "average" person would score quite high on a scale from 100 years ago.
How is that possible? Genes did not change in 100 years. The environment did: longer schooling, better nutrition, healthier childhoods, and a world that encourages abstract thinking. That is why tests are periodically "reset" (renormed) so the average comes back to 100. In other words, average IQ is a moving target.
What about Turkey?
To be honest, there is no nationwide, representative, up-to-date "IQ count" for Turkey — or for most countries. So there is no exact figure that says, "Turkey’s average IQ is this." The tables circulating online, which usually place Turkey around the late 80s to 90s, are based on the controversial, small-sample Lynn data mentioned above; they are not scientific measurements.
The more meaningful picture is this: in Turkey, enrollment rates, years of education, nutrition, and health conditions have improved dramatically over the past few decades. If you think in terms of the Flynn effect, improvement in these conditions is one of the strongest factors pushing test performance upward. So instead of talking about a country’s "IQ," it makes much more sense to look at how much that country invests in education and child health.
So what should we take from these numbers?
To sum up: average IQ is 100 on any proper scale — it is not a ranking of achievement, but a reference point. Cross-country IQ comparisons are almost meaningless, as critics put it, because the samples are not fair, the tests are not culture-free, and "average" is not a fixed thing anyway.
What matters most for you is not a country average or your place in a table, but keeping your own mind curious, active, and open to growth. As the Flynn effect shows, mental performance can be shaped by environment, habits, and practice.
If you want to see where you are right now, you can start with our free IQ test with no registration needed — but remember, it is not a label, just a snapshot. And if you want to exercise your mind in different ways, check out our brain games; logic, memory, and attention games are a much more enjoyable challenge than wondering where you rank above or below average.